

Forex Multi-Time Frame Analysis Made Easy: Tips for Smarter Trading
Multi-timeframe analysis is a powerful and precise method in technical analysis that allows traders to examine charts in detail and accurately identify price trends. This approach offers numerous advantages, and one of its most important features is enabling traders to effectively recognize price movement cycles and better understand the direction and behavior of price movements.
This method is highly beneficial for both amateur and professional traders, and many traders utilize this approach. In fact, multi-timeframe analysis is considered a selective and stylistic trading method. In this article, we will provide a comprehensive review of multi-timeframe analysis and its advantages.
How Does Multi-Timeframe Analysis Work?
In multi-timeframe analysis, typically 2 or 3 different timeframes are selected. First, in the highest timeframe, the market trend and market cycle are analyzed and identified. Then, in the lower timeframe, the market structure is carefully examined and based on that, the position is opened.
For example, if we choose the 15-minute and 5-minute timeframes for multi-timeframe analysis, we first identify the market trend and market cycle in the 15-minute timeframe. Then, we move to the 5-minute timeframe, analyze the market in more detail according to our strategy, and enter the position in this timeframe.
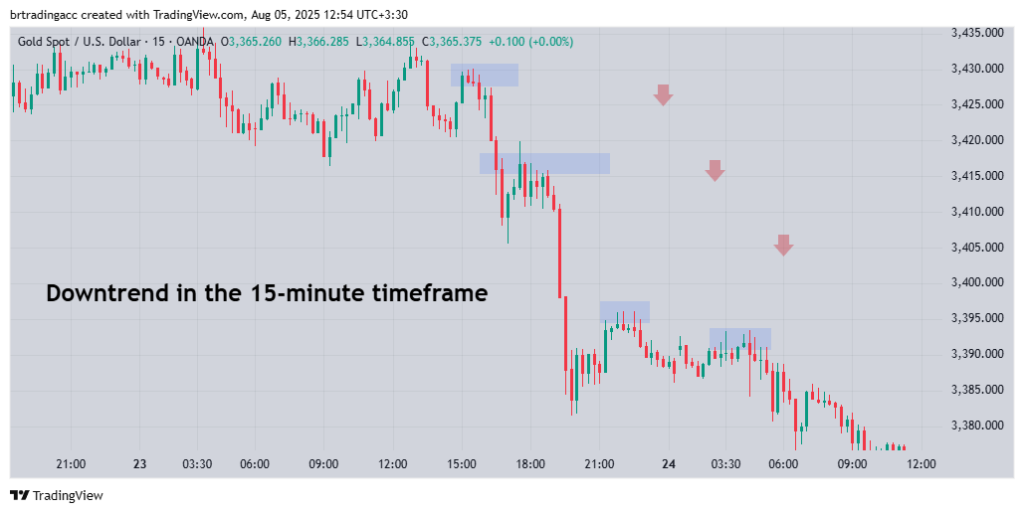
Photo by TradingView
For multi-timeframe analysis, we first selected the 15-minute and 5-minute timeframes. Then, as shown in the image above, we zoomed out on the 15-minute chart and examined the overall market context. Using simple tools such as trendlines, lower highs, lower lows, and assessing the strength of the trend through bearish spikes and candles, we determined that the market trend is bearish.
Then, after identifying the market trend direction and analyzing the market cycle, we moved to a lower timeframe, the 5-minute timeframe, to enter a position in the direction of the trend according to our strategy and to analyze the chart in greater detail.

As you can see in the example above, on the 5-minute timeframe, we entered short positions in the direction of the trend by using trendlines and identifying patterns, resulting in successful trades. We recommend that if you are a beginner or amateur trader, you use a multi-timeframe analysis approach to better identify market trends and cycles accurately, and to enter positions with greater precision.
Key Tips for Multi-Timeframe Analysis
Zoom Out the Chart on the Higher Timeframe
To identify the market trend and detect cycles on the chart, you should first zoom out your chart. This allows you to clearly observe market movements and gain a comprehensive view of the chart and price behavior.
Avoid Constantly Switching Timeframes
In multi-timeframe analysis, there is no need to constantly switch between timeframes because this can confuse us and reduce our focus, making it difficult to find suitable entry points. For multi-timeframe analysis, we first carefully identify the market trend on the higher timeframe, then move to the lower timeframe for more precise analysis, setting the take profit and stop loss levels, and finally entering the position.
We hope that you have enjoyed this article.