

moving average indicator strategy in forex 2025
Indicators are tools that help us analyze the market more easily and trade successfully. Moving Average Indicator is one of the most popular and useful indicators. the moving average takes the average of the prices in a period of time and displays it on the chart. You can choose the time period of the moving average as you like and you can use it in different time frames.
Do moving averages act as support or resistance?
Moving averages have another important use, moving averages act as support and resistance in the chart, that is, when the candles are hitting it, they can act as a support zone or they can have a role of resistance. When the moving average line is above the price on the chart, it acts as resistance for the price, and when the moving average line on the chart is below the price, our moving average acts as support.
If the moving average line is above the price and the price breaks it upwards, the role of the moving average changes from resistance to support. Today we will learn one of the most important and popular moving average strategies.
Moving Averages Settings
First you need to add two moving averages to your chart, then go to your indicator settings and click on Length in the Input option. Then set the length of one of the moving averages to 200 and the other one to 100. Change the color of the moving average with the length of 200 to red and the color of the moving average with the length of 100 to yellow.
How to trade with moving averages
When the yellow moving average crosses the red moving average upwards, we should expect an upward movement and probably the price will rise and we can look for a buy position.
And when the yellow moving average crosses the red moving average downwards, we should wait for the bearish movement of the market and probably the price will decrease and we can look for a sell position.
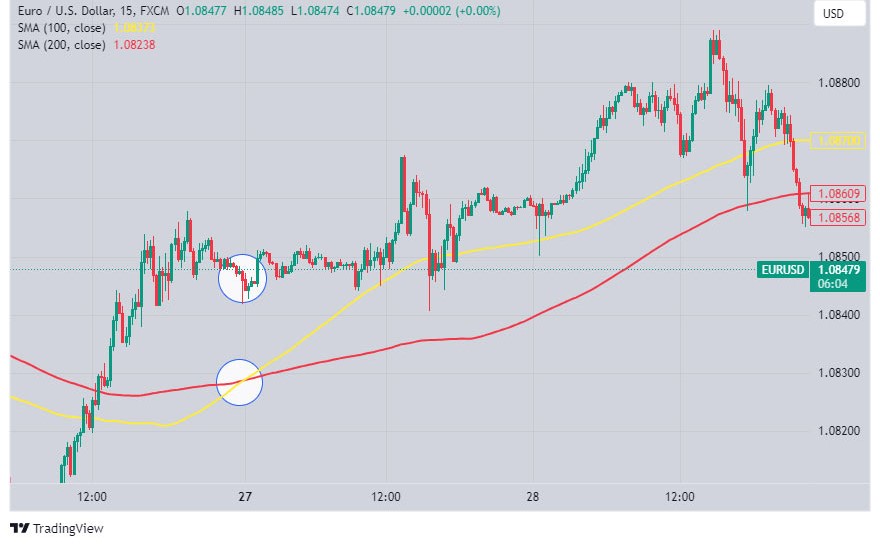
Photo by TradingView
Notice the photo above. The yellow line is the moving average 100 and the red line is the moving average 200. In the image above, when the yellow moving average crosses the red moving average on the chart, the price has increased and we can look for buying positions in these areas.
Also remember that the yellow moving average has crossed the red moving average upwards. And you can see that after the yellow moving average crossed the red moving average upwards, the moving averages act as support. Every time the price hits them, it is supported.
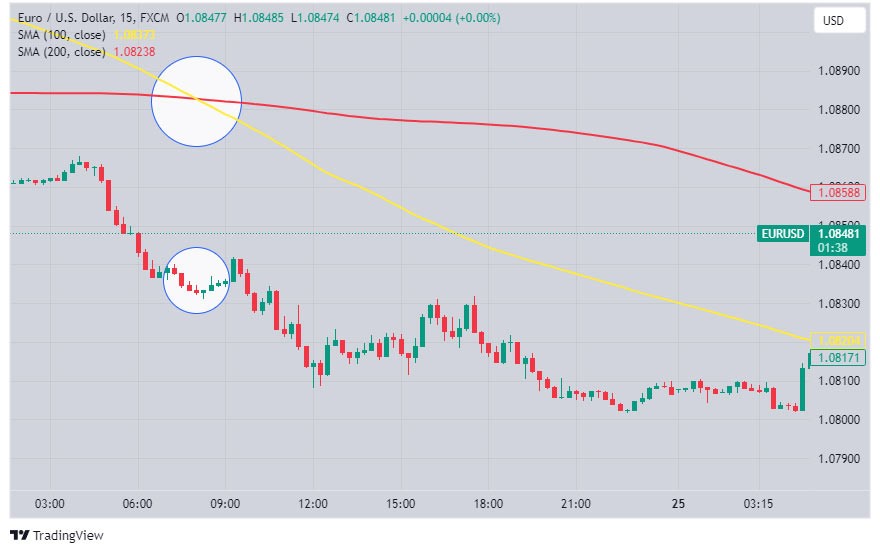
Photo by TradingView
Notice in the photo above that when the yellow moving average crosses the red moving average to the downside, the trend has become bearish and the price has started to fall, We should be looking for selling positions in these areas so that we can move with the downward trend, and make a profit, because ultimately our goal is to make money.
We hope you enjoyed this article.