

how to use pivot point in forex trading 2025
Today we are going to talk about one of the most useful forex strategies called Pivot Point. Pivot points show us very important resistances and supports in the chart using information such as time, price, trend strength and market liquidity. This indicator shows us important supports and resistances in the chart in the form of horizontal lines.
Support levels on pivot points
The Pivot Point indicator shows us the support levels in the chart as horizontal lines with red color. The Pivot Point Indicator shows us the support levels in the chart as horizontal lines with red color. And the price can increase and go up by reaching these support levels. In pivot points, S stands for support levels, which consist of three support levels: S1, S2, and S3.
If the price breaks the S1 pivot level on the chart, we expect the price to reach the S2 level, and if it breaks the S2 level, we expect the price to reach the S3 level. Support at the S3 pivot level is stronger than S2, and support at the S2 level is stronger than S1.
Resistance levels on pivot points
The Pivot Point Indicator shows us the resistance levels on the chart with green horizontal lines. And the price can decrease by reaching these lines and resistance levels. In pivot points, R stands for resistance levels, which consist of three resistance levels: R1, R2, and R3.
If the price breaks the pivot level R1, we expect the price to reach R2, and if R2 is broken, we expect the price to reach R3. Resistance at pivot level R3 is stronger than R2, and resistance at pivot level R2 is stronger than R1.
Look at the photo below
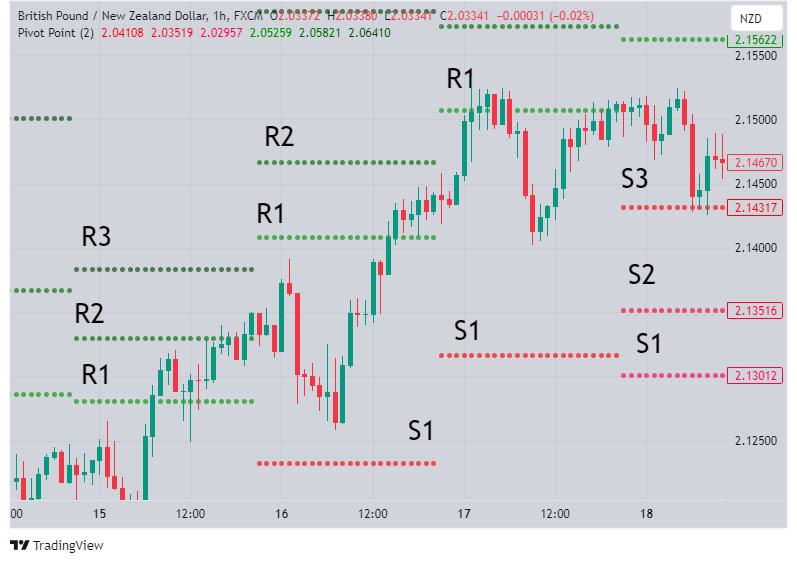
Photo by TradingView
Look at the image above, the resistance and support levels are very clearly shown on our chart and the price reacts when it reaches these lines. The market always reacts to resistances and supports. We can easily find the support and resistance levels by using pivot points.
We hope you enjoyed this article.