
How to Use the Chart Features in TradingView for Beginner Traders – 2025 Guide
TradingView is the best website and virtual platform in the world for analyzing financial markets such as Forex, Crypto, etc. You can also trade on it by connecting your trading account to TradingView. This site is very popular among traders and has many fans around the world. This site was created in 2011 by several professionals. One of the good features of this site is that it has very accurate and diverse tools for analyzing charts. These tools help traders to analyze the chart more accurately and easily and to make successful trades.
How to Use TradingView for Technical Analysis
To use this site, you must first sign up and create an account, then you can use the charts and tools.
Each user can share photos and videos of their trades, strategies and ideas on their account. You can see the strategies of other people and professional traders on this site and share your opinions and ideas with them.
How to select markets and add currency pairs or symbols to the chart and watchlist
You can access many markets such as stocks-funds-forex-crypto-bonds-economy in Trading View. You can analyze all currency pairs and stocks on the Trading View website.
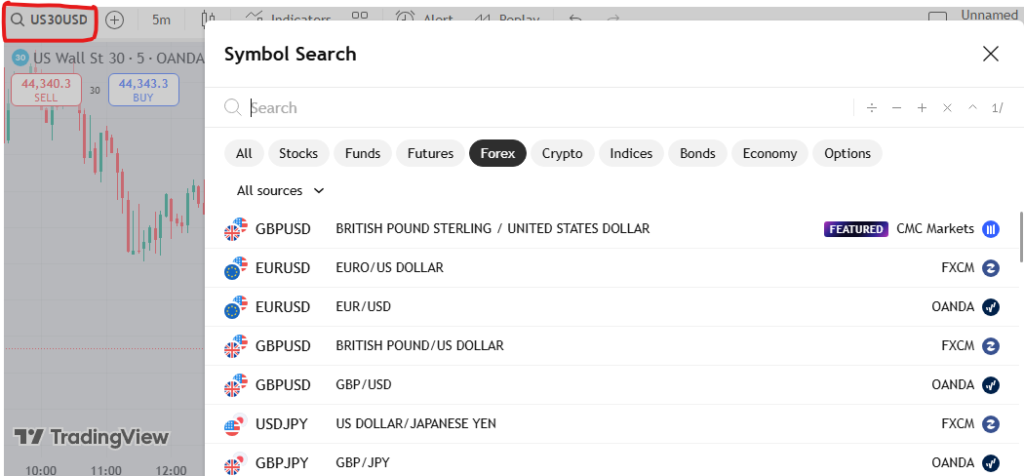
Photo by Trading View
In the image above, you can go to the markets page by clicking on the symbol search box at the top of the page. You can see all financial markets in the image above. You can click on any market to see all its currency pairs and stocks and then add them to your chart or watchlist.
Technical analysis and drawing toolbar
One of the features of the Trading View website is that it has many tools for all kinds of strategies and analysis. Traders can easily analyze the chart with the help of these tools.
See the image below
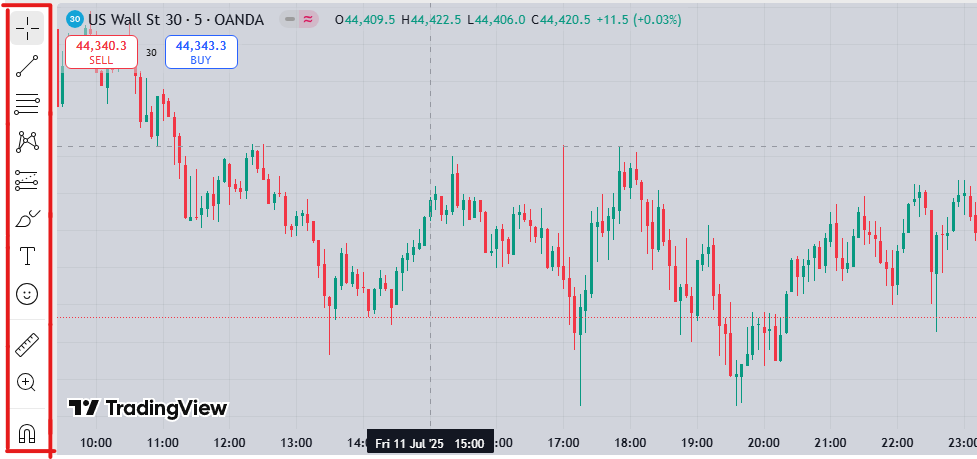
Photo by Trading View
On the left side of the image you can see the toolbar, all the tools you need are there in this part, tools for drawing lines and Fibonacci, rulers, risk/reward drawing tool and many other tools you need.
Indicators Window, Candlestick Settings, and Timeframe Selection
If you click on the Indicators option in the horizontal line at the top of the screen, you will see all the available indicators. On this page you will find all the professional, simple and popular indicators so that you can use them for the best analysis. Automatic tools for finding all kinds of patterns on the chart are also available on this page.
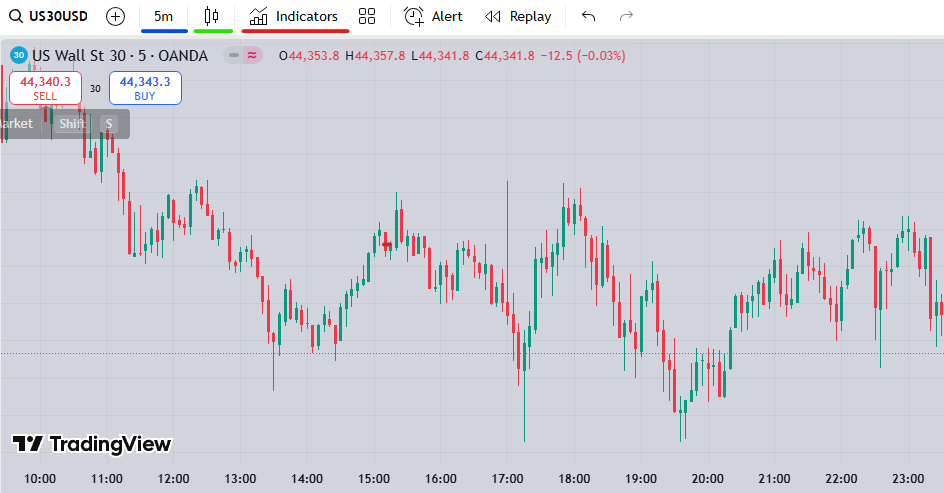
Photo by Trading View
By clicking on the candlestick icon highlighted with a green line, you can change your chart display from candlestick to other types such as line charts. Also, by clicking on the icon highlighted with a blue underline, you can change your timeframe. Go to the Trading View website and enjoy its tools and features.
We hope you enjoyed this article.