
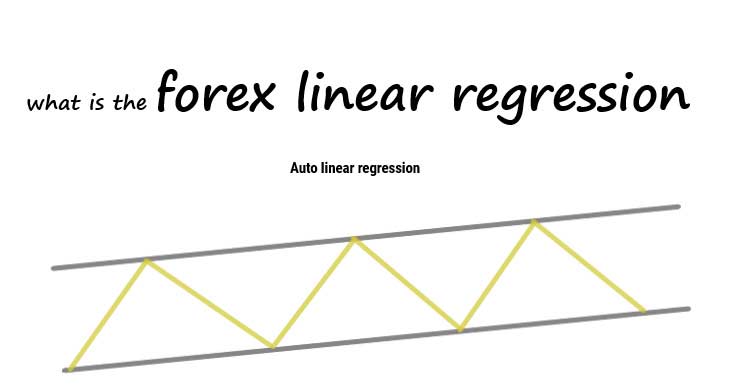
What is The Forex Linear Regression
Today we are going to talk about one of the best technical analysis tools on the Trading View website. It is called Regression Trend. With Regression Trend we can draw the channels in the best way. The regression trend tool automatically draws sideways and ascending and descending channels for us, and we can trade in these channels at the highs and lows, Regression Trend makes it very simple and easy for us to draw channels on the chart.
How to draw Linear Regression Trend?
One of the best forex trading strategies is to draw channels on the chart, drawing channels makes the chart clear for us and we can better analyze the market. Go to the toolbar on the trading view page, select the second option and click on regression trend.
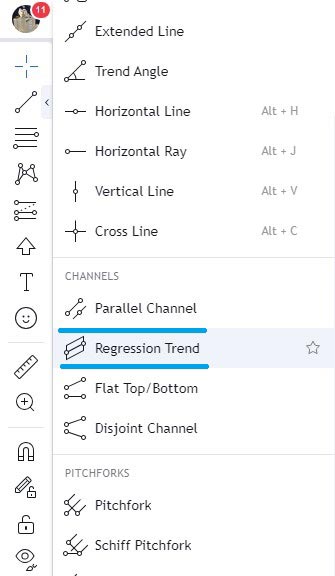
Photo by Trading View
It is very important to draw the regression trend correctly, in a downtrend you need to connect the highest price at the beginning of the trend to the lowest price in the trend. Note that this model of plotting and finding points for plotting regression trends is specific to downward trends. For upward and sideways trends, the way to plot the regression trends is different.
See the photo below
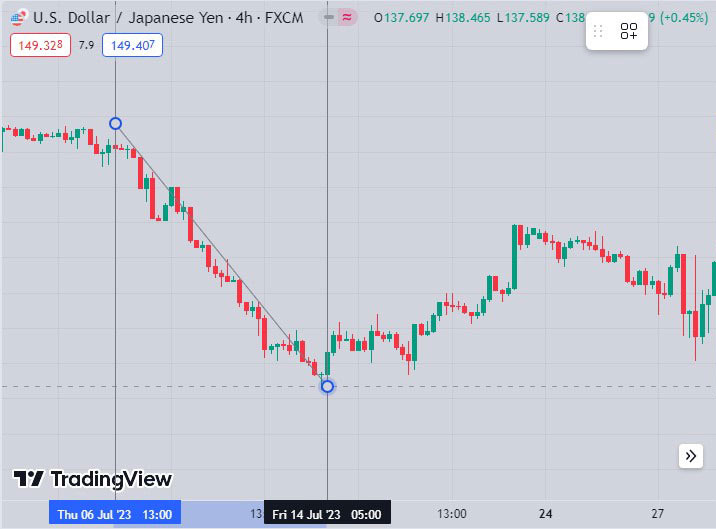
Photo by Trading View
Having drawn the regression in the 4 hour time frame, we now move to the 1 hour time frame and take a closer look at the chart. Notice that whenever the price hits the bottom of the channel, the price has gone up and Whenever the price hits the ceiling of our channel, the price has gone down. See the photo below
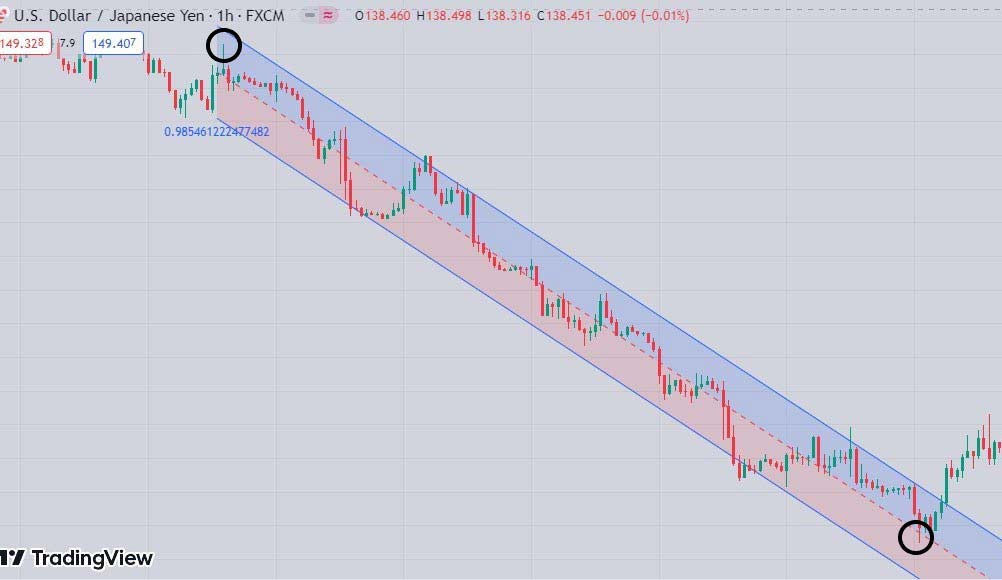
Photo by Trading View
Whenever the price hits the bottom of the channel you can open a buy position and whenever the price hits the top of the channel you can open a sell position. Go to your chart in the trading view and enjoy the regression trend tool.
We hope you will find this article useful.