

what are best Tools to work with RSI
Today we want to talk about one of the best forex strategies that has a high win rate and is very profitable at the same time. This strategy consists of a combination of the RSA indicator and a tool called the trend line. For this strategy you first need to add the RSA indicator to your chart in TradingView. Then look for ascending or descending or side channels in your chart and draw them.
As you know, to draw the channels, we find two highs and two lows and draw a trend line for them. To draw the channels, you can also use the regression trend tool to automatically draw the channels for you; in the previous articles, we learned how to draw the channel using the regression trend tool.
Why do we combine the RSA indicator with the channels?
When 2 appropriate tools are combined, their power and accuracy increase, and we can make more successful and better deals.
How to trade this strategy
1_ When the price reaches the ceiling (resistance) of our channel and at the same time we reach the overbought point on the RSA indicator and the RSA number is greater than 70, we can open a sell position and enter the trade.
2_ When the price reaches the bottom (support) of our channel and we reach the oversold point and the RSA indicator is less than 30, we can open a buy position and enter the trade.
Go to the 4-hour time frame on your chart and draw a channel in the direction of the market trend. After drawing the channel, add the RSA indicator to your chart, then go to the 1-hour time frame and look for a suitable entry point.
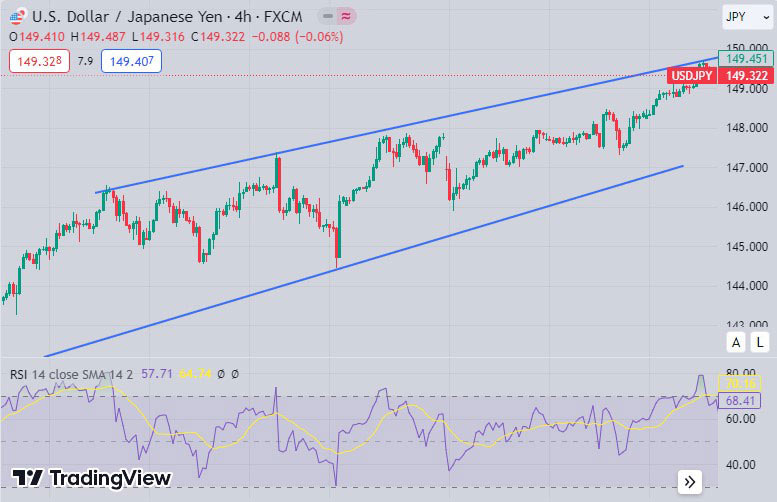
Photo by Trading View website
In the image above we have drawn the ascending channel on the 4 hour timeframe and then added the RSA indicator to our chart. We will now switch to the 1-hour timeframe to find a suitable entry point.
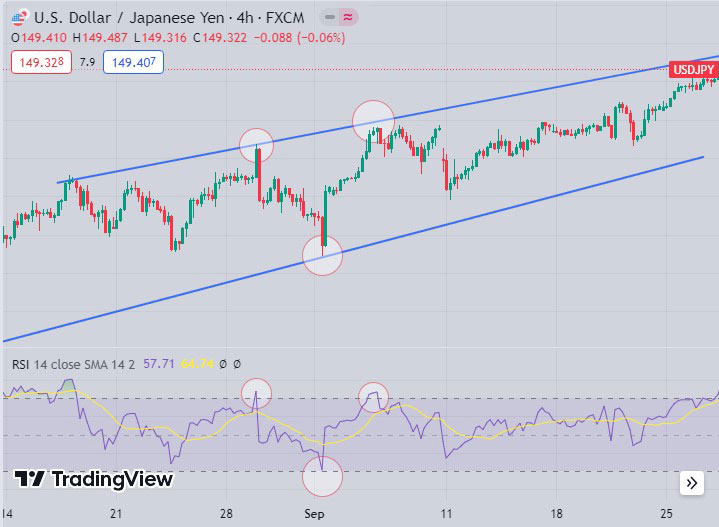
Photo by Trading View website
Note the image above, the white circles marked in the ascending channel are our entry points. In the above example, when the price reaches the ceiling (resistance zone) of our channel, we see that the RSA indicator number is more than 70 and we realize that we have reached the overbought zone. At this time, the price will decrease and we could make a profit by opening a sell position.
Also, when the price has reached the bottom of our channel and the RSA indicator also shows the number 30, we can enter the buy position.
We hope you enjoyed this article.