

what is Fibonacci retracement in forex trading
One of the most important and popular technical analysis tools is the Fibonacci retracement. This tool is very popular among traders because of its high accuracy and high winning rate. Moreover, Fibonacci is very easy and simple to use. You will be able to use this tool as one of your best trading strategies.
Fibonacci retracement involves several very important levels that are used to identify support and resistance levels in the chart. Also by using Fibonacci lines we can determine our entry point, stop loss and profit limit. In order to use Fibonacci we need to specify and personalize some levels in the settings of this tool, today we want to introduce you to Fibonacci retracement levels and also learn how to set them.
How to change numbers in Fibonacci settings
In the tradingView, add the Fibonacci retracement to your chart from the toolbar on the left side of the screen and go to its settings. To use Fibo, we only need the numbers 0.382, 0.618, -0.272, 0.5, 0.786 and -0.618 and turn them on in the Fibo settings. Enter the numbers in the Fibo settings as shown in the picture below.
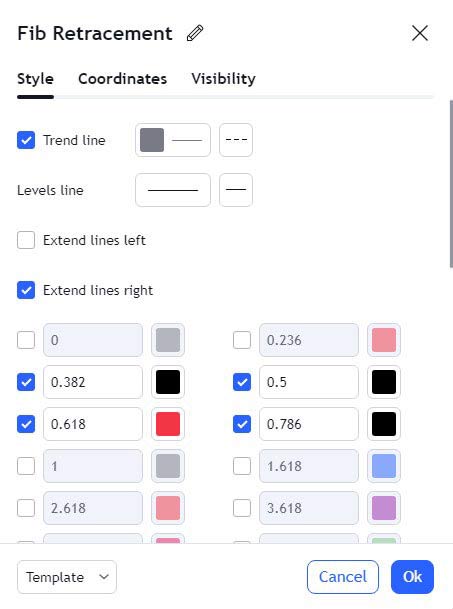
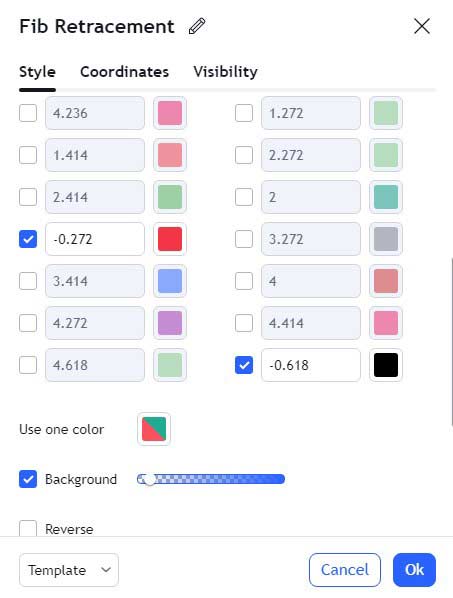
Photo by Trading View website
The numbers -0.618 and -0.272 are our profit limits. The number 0.618 is the line that the market usually pulls back to and it is a very important level. The price always reacts to the Fibonacci lines and We can use these lines to identify support and resistance.
How to draw a Fibonacci retracement on a chart
To use Fibonacci, we need to see a strong movement in the chart. If the trend is bullish, we connect the Fibonacci from the bottom to the top of the trend or impulse and wait for the market to make a corrective move. This correction should be at least to the 0.382 Fibonacci line.
You can use this strategy in weekly and daily timeframe, draw Fibonacci in daily or weekly timeframe and to find the entry point you must go to the 4-hour timeframe, but to make your entry point more accurate you can also go to the lower timeframe.

Photo by Trading View
In the image above you can see how to draw Fibonacci and we have also specified how to draw it with white circles. After drawing the Fibonacci, the market makes a corrective move and goes down to our 0.382 Fibonacci level and then continues its upward trend.
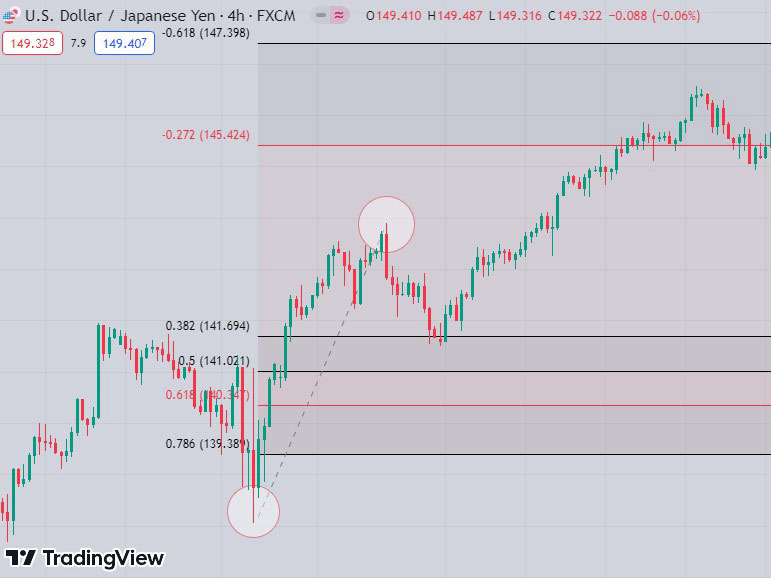
Photo by Trading View
As you can see in the image above, after drawing the Fibonacci on the daily timeframe, we go to the 4-hour timeframe to find the entry point. In this timeframe, we should wait for the market correction and look for a valid entry point.
Finding a valid entry point after the market reacts to the Fibonacci lines is one of the most important steps in this strategy.
We hope you enjoyed this article.