
forex trading with volume indicator 2025
In this article we would like to introduce you to one of the best and most efficient financial market indicators called Volume, the Volume indicator shows you the amount of market volume and the amount of trades or the liquidity of the market in general.
We all know that the best time to trade is when the market has good and large swings and movements. The movements and fluctuations of the market depend on the liquidity of the market, meaning that the greater the volume of trades and the greater the liquidity of the market, the faster and larger the movements and fluctuations, And we can understand market liquidity or market volume by using this indicator.
By using this indicator, we can increase our profit on our trades and reduce the risk of our trades, thus making our trades more valid and increasing our win rate.
Green and red columns in the volume indicator
This indicator consists of vertical bars colored in red and green. These bars represent the strength of buyers and sellers in the market. The red bars indicate the strength of sellers in the market, while the green bars show the strength of buyers. For example, the more green bars there are and the larger their size compared to the red bars, the stronger the buyers are in the market at that moment compared to the sellers.
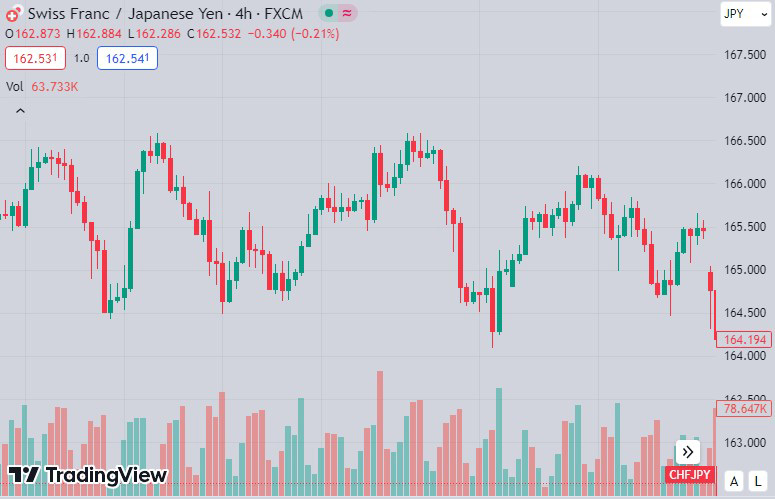
Photo by Trading View website
In the image above we have added the volume indicator to our chart. this indicator is displayed as columns at the bottom of the chart. The longer the green columns are, the more pressure and power the buyers have, and the shorter they are, the less power the buyers have.
The longer the red columns are, the more power the sellers have, and the shorter the red columns are, the less power the sellers have. A very powerful strategy can be made by combining the volume indicator and price action analysis, But you need to backtest this strategy many times to become a master at implementing it.
We hope you enjoyed this article.