
Best Forex Reversal Trading Strategies for 2025: Price Action & Trend Reversals Explained
In the Forex and financial markets, identifying price reversal points is very important, and successful and professional traders are proficient in identifying these areas and points. These points enable us to identify and hunt a trend as soon as it begins. They also create excellent trading setups with favorable risk-reward ratios, which allow us to earn a good profit. Now we can identify these points using reversal patterns. In the rest of the article, we will introduce and examine the best reversal patterns. Stay with us.
Trendline Breakout Strategy
One of the best price reversal strategies is the trendline breakout strategy. It can generate substantial profits if executed correctly. It is considered one of the most popular technical analysis strategies because it is very simple, even for amateur traders, and has a high win rate.
First, we identify a trend on the chart and draw a trend line. When the trend reaches the end of its movement or encounters significant resistance on the chart, we wait for the price to break through the trend line with a strong candle. Once the market makes a valid break of the trend line, we can enter the position.
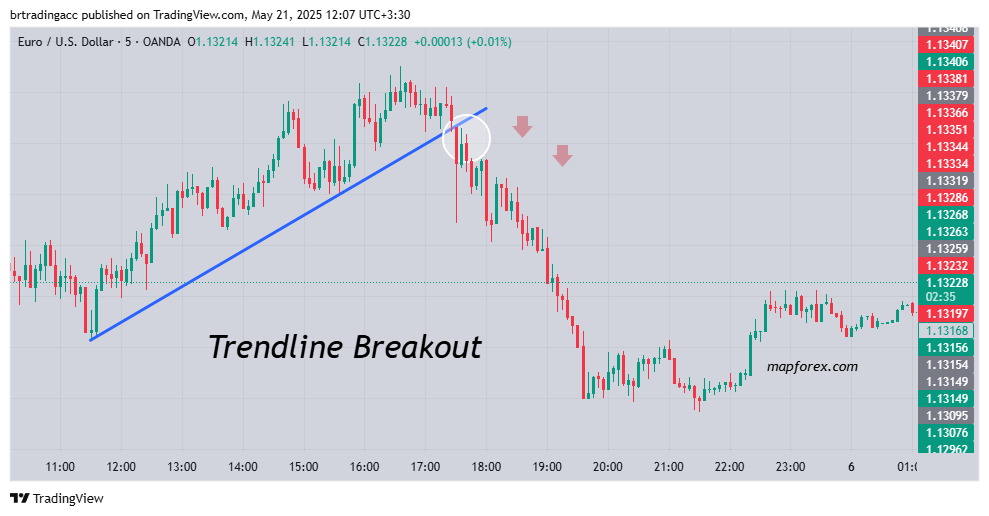
Photo by TradingView
As shown in the above image, the price has been on an upward trend, forming higher highs and higher lows, and as a result, We have drawn an ascending trendline for this trend. When the number of candlesticks with long shadows increases and the market fails to make higher highs and higher lows, it indicates that the trend has reached its end. At this point, we have to wait for the price to break through the trendline. As you can see in the image above, the price has broken our trendline with powerful candles and the trend has reversed.
triangle patterns
Another price reversal pattern is the triangle pattern. These patterns are abundant on charts and have a high win rate, making them one of the most reliable patterns. Triangle patterns are very popular because they are easy to trade. Both professional and amateur traders can use them.
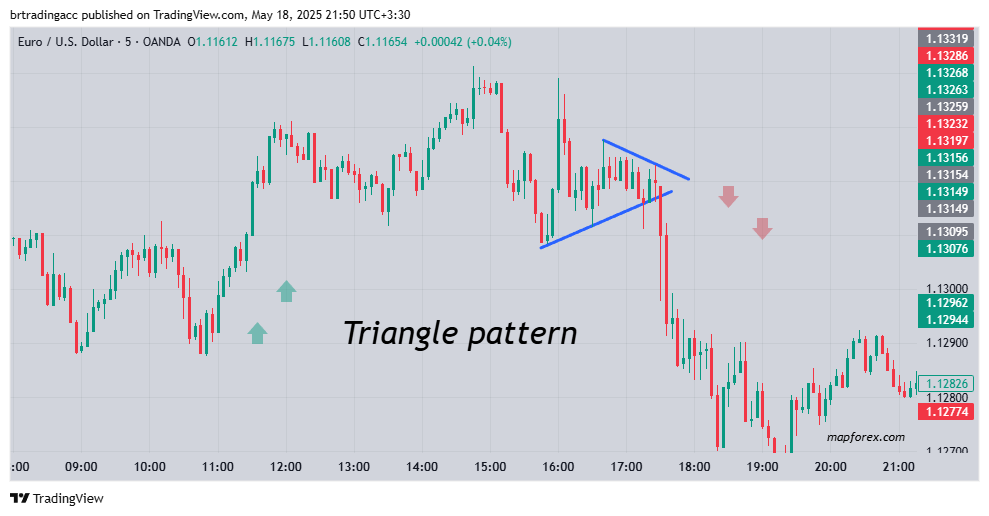
Photo by TradingView
Look at the left side of the image above. The price moved up with strong, full-bodied candles, forming higher highs and higher lows. Then, we see that the price lost its upward momentum, forming a resistance area. In this area of resistance, you can see that the price formed a triangle pattern, and With the downward breakout of this pattern, the price reversed.
Double Top and Double Bottom Patterns
One of the most common patterns in the financial markets is the double top and double bottom pattern, we want to use these patterns to find price reversal points. When the price hits a important support or resistance area and fails to break through it, and then forms these patterns in that area, we can expect a trend change or price reversal.
Important Note: In this strategy we look for double top patterns at the end of uptrends and double bottom patterns at the end of downtrends.
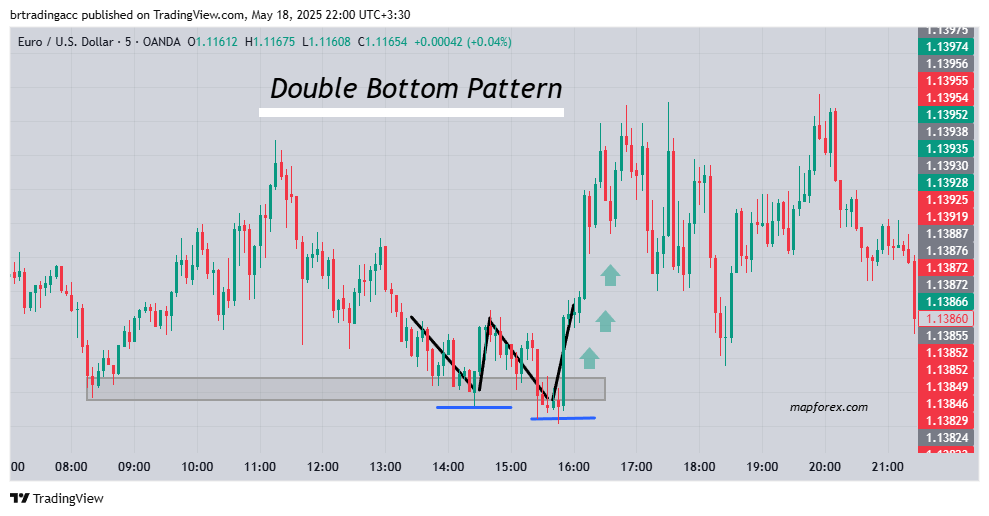
Photo by TradingView
For example as shown in the image above, the EUR/USD currency pair has experienced a downtrend on the five-minute timeframe, has reached an important support level. The price then has failed to break this support level, forming a double bottom pattern. After the pattern has been completed, the price has reversed and moved upward. For uptrends, we look for a double top pattern at significant resistance levels. After this pattern forms and strong bearish candles appear, we expect the price to reverse.
We hope you enjoyed this article