
How to Use the RSI Indicator Effectively in Forex Trading (2025 Guide)
RSA indicator or Relative Strength Index is one of the most important indicators in financial markets such as Forex and Crypto that we use for chart and market analysis, and it is a very popular indicator because it is very easy to use, and also the signals It has high credibility and we can make money and earn profit by learning it in Forex. The RSA indicator shows us the strength of the trend and the weakness of the trend, and we can use this tool to check the strength and pressure of the trend in the chart. We can also understand the strength of buyers and sellers in the market. In technical analysis this strategy and this indicator are very much used.
How to Use the RSA Indicator?
In the RSI indicator two numbers are very important for us and we can do our analysis based on these two numbers. The numbers 30 and 70, these two numbers are very important for us, because whenever we reach these numbers in the indicator, we can open suitable positions.
When the RSI indicator reaches the number 30 or less, it means that the market has reached the oversold area. And buyers will enter the market and move the price up, and when the RSI indicator reaches the number 70 or more, it means that the market has reached the overbought area, and probably the sellers will enter the market and move the price down.
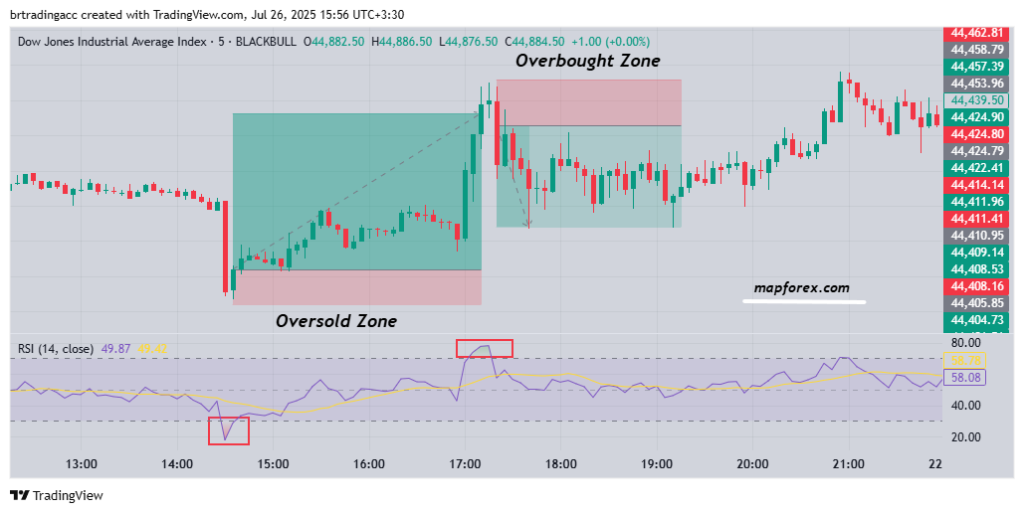
Photo by TradingView
Look at the above image, now you can see the RSI indicator, look at the numbers 70 and 30, whenever the price has reached these areas, it has shown strong reactions and the price is moving between these two numbers.
When the indicator has shown more than number 70, and the market has reached the overbought area, the price has moved sharply down, and the sellers have entered the market, and they have driven the price down, and whenever our indicator number dropped below 30, buyers entered the market and raised the price because we had reached the oversold area.
We hope that our article has been useful to you.