

How to use MACD indicator in forex trading 2025
Indicators are dependent on the price and move based on the price, indicators are one of the tools that help us in technical analysis in forex and crypto to do a successful analysis, one of these trusted indicators is MACD. MACD indicator consists of several parts and is very popular among traders. It is one of the most widely used indicators. today we will learn how to use this indicator.
What are the parts of the MACD indicator?
The MACD indicator consists of a signal line, a MACD line and histograms. In the rest of the article we will discuss the complete training of this indicator. With the help of MACD we can have a better understanding of trends or we can identify changes in trends.
In the first part we will introduce MACD lines and signal lines. We will learn how to work with them. With the help of MACD we can have a better understanding of trends or we can identify changes in trends. In the first part we will introduce MACD lines and signal lines. We will learn how to work with them.
Whenever the signal line and the MACD cross each other upwards, we should expect upward movements and the price to rise, and when the MACD line and the signal line cross each other downwards, we should expect the price to decrease and a downward movement.
But here is an important point about this strategy
We should always look at the distance between the signal lines and the MACD lines, because the greater the distance between them before they cross, the more valid this signal is for us. If these lines are on top of each other or move with a small distance, we do not pay attention to it.
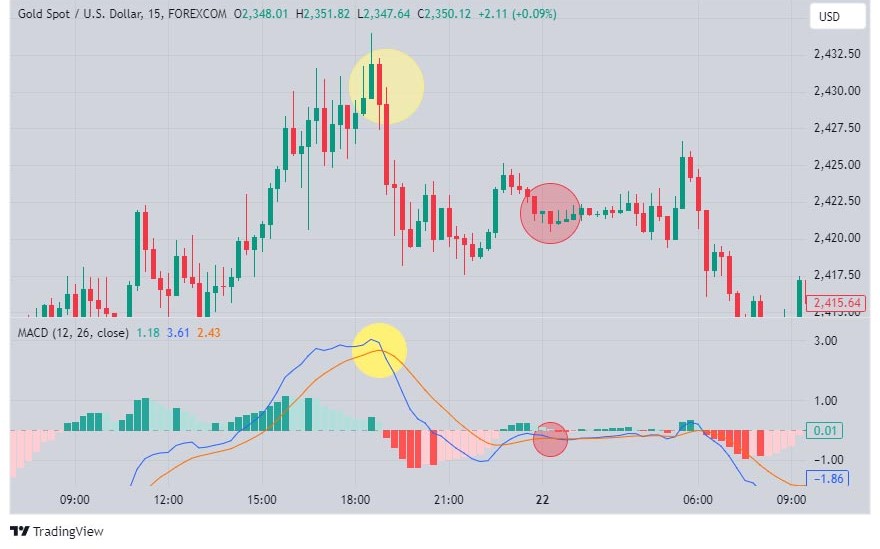
Photo by TradingView
In the image above, we could enter the trade at the yellow circles because before the MACD and signal lines crossed, there was a long distance between them and this signal is highly valid for us, But at the red circle we do not enter the trade because the lines are on top of each other and there is no distance between them.
Note the yellow circles, when the MACD and the signal lines cross each other downwards, in our chart the price has dropped and the trend has become bearish, you could simply open a sell position in this area.
Histograms in MACD
Histograms show us the strength of the trend and the strength of buyers and sellers in the market. The height of the histograms is very important to us.
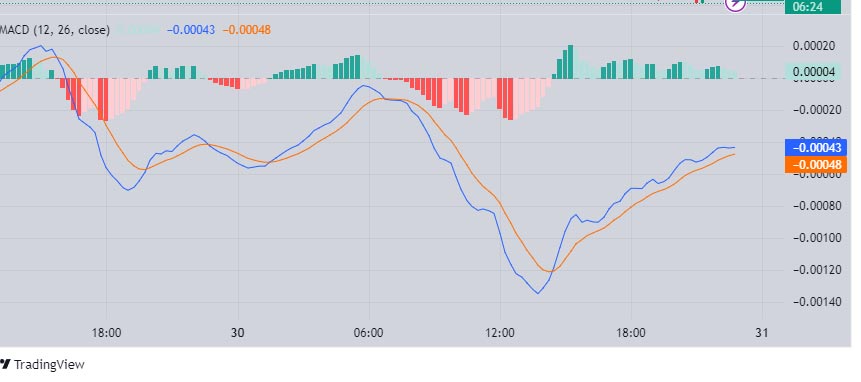
Photo by TradingView
The longer the histograms, the stronger the trend. The green histograms pointing up show the strength of the buyers. And the red histograms pointing down show the strength of the sellers.
We hope this article was useful to you.