

fake Breakout Forex Trading Strategy
In this article, we are going to talk about one of the most important forex topics called fake breakouts.
Breakouts are one of the best and most profitable trading strategies. Breakouts can be considered one of the most important topics in technical analysis within financial markets. The breakout strategy is among the most popular strategies used by traders in the Forex market. Trading with breakouts can be highly profitable and yield good returns, but correctly identifying breakouts and distinguishing them from fake breakouts is also very important.
When we are able to properly identify valid breakouts, we can also effectively recognize fake breakouts in the market and trade based on them. If we fail to correctly identify fake breakouts, they can cause us to enter wrong positions and incur losses. Fake breakouts have signs that we can use to correctly identify them.
Breakouts
When the price breaks our support or resistance levels with strong, full-bodied candles and then continues to move in the direction of the breakout, we say a valid breakout has occurred. A breakout can occur from a support or resistance level, or from a pattern.
Fake breakouts
Fake breakouts are unsuccessful attempts to break the support or resistance level, after which the price either returns to its previous trend or starts moving in the opposite direction. In fake breakouts, after attempting to break the desired level, the price usually forms a strong or full-bodied candle in the opposite direction of the breakout attempt, or forms a clear pin bar at those levels, because we can also call each pin bar an unsuccessful breakout attempt.
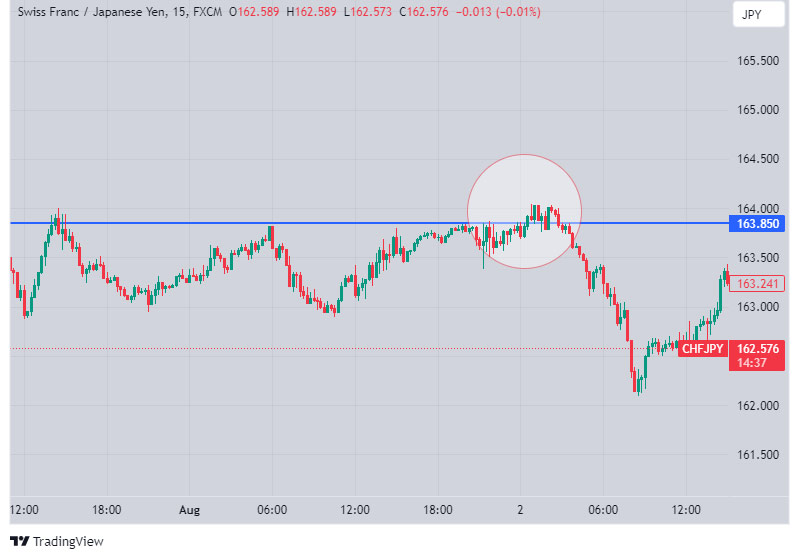
Photo by Trading View website
As you can see in the image above, we have a resistance level that we have marked with a blue line, the price has tried to break out of the resistance area and move higher, but it has failed and its attempt has become a fake breakout.
As you can see, the price attacked the resistance level with small candles and failed to make a full breakout, and after forming a few weak candles and a very small trading range, it has dropped back below the blue line or the resistance zone. We call the price movement in the white circle in the image above a fake breakout. Also, when the price returns below the blue line and pulls back to it, we could enter the sell position and profit from the price drop.
Also, in the example above, in the area highlighted by the circle, we can see bearish candles without shadows and a pin bar, which indicates that a fake breakout is occurring.
We hope you enjoyed this article.