
descending triangle patterns in forex 2025
Trading with technical patterns is considered one of the most popular methods among traders, mainly because of its simplicity and profitability. In this article, we will introduce one of the most practical and widely used patterns in technical analysis: the descending triangle pattern. This formation is most often applied to identify selling opportunities in the market. Thanks to its clear and simple structure, traders can easily spot it on the chart, making it one of the well-known and popular patterns in technical trading. The descending triangle pattern is usually recognized as a continuation pattern in a downtrend and can serve as a powerful tool in your trading strategy.
Join us in this article as we explore this pattern, learn how to identify it on the chart, and discover how to trade it effectively.
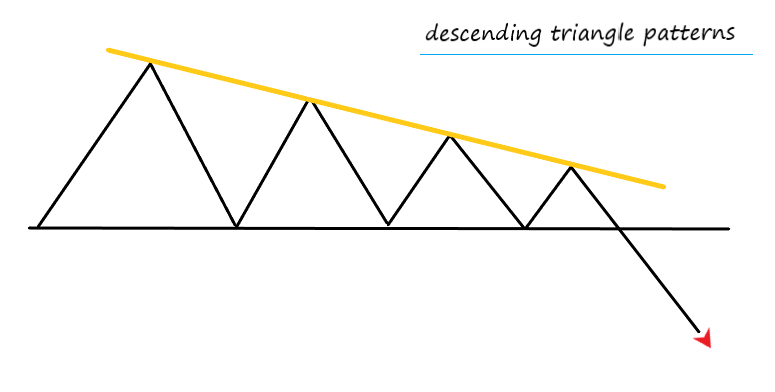
In the chart above, you can see a descending triangle pattern. This pattern consists of a horizontal support level and a descending resistance line that forms a downward trendline. The price becomes compressed between these two levels, and its swings gradually shorten until it reaches the end of the triangle. It then breaks the pattern to the downside with a sharp and strong move and continues its downward trend.
Consider the following example
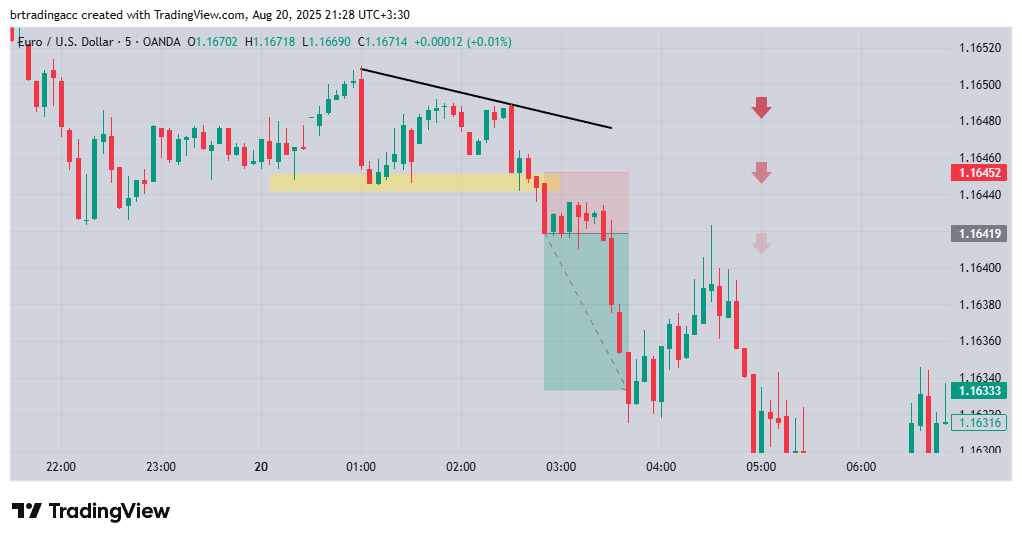
Photo By TradingView
In the example above, you can clearly see a descending triangle pattern on the chart. After the price was compressed within the formation, it eventually broke to the downside. Once the breakout occurred and a bearish confirmation candle was formed, we entered a sell position and profited from the continuation of the downward trend.
In conclusion, the descending triangle pattern is one of the key continuation patterns in technical analysis. By identifying it correctly and using it properly, traders can capture valuable trading opportunities in line with the bearish trend.
We hope you have enjoyed reading this article